Guest Post: How Talking Points Memo uses chartbeat
This is a guest post from Al Shaw, Associate Publisher at Talking Points Memo. Thanks Al!
As a real time news organization, TPM is obsessed with stats. For both our editorial process and publishing strategy, we need to know how our audience is interacting with us. But as an organization built from scratch we’ve always managed to be Ramen Profitable by using free or inexpensive software solutions. For metrics, that meant Google Analytics. Their application is excellent, but it is slow. Accurate data isn’t reported for hours, sometimes a day later. Chartbeat’s, by contrast, is real time. It reports exactly how many people are sitting on these stories *right now*. Neither one of these tools paints a full picture of site activity, but put together they form a powerful analytics package.
Using Chartbeat’s API (alongside the new Google Analytics API), I have developed a few tools for TPM that have changed our workflow to account for the instant feedback our readers are giving us with their clicks.
Internal Tools
Mashing up APIs from GA and Chartbeat, I built an internal dashboard called TPMTools, which is a heads-up display of various important metrics on the site. On this dashboard there are two Top Ten lists: one from Google Analytics (which gives the top ten stories by pageview within a specified date range), and a second, called Now10, that uses Chartbeat’s toppages method to call the current top ten stories based on real time traffic. The first list gives a good daily perspective of overall story popularity, and the second gives our editors a sense of what is surging. Since we’ve had this dashboard, our editors have used it more and more to decide where to place stories. We can also use it to see which of our stories are poised to go viral on social media sites.
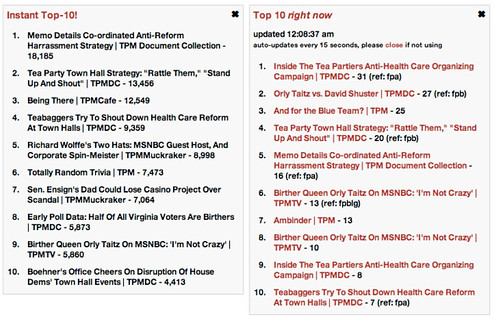
This snapshot comes from early morning Tues., Aug 4. The numbers in the left module are total pageviews on stories that Google has counted so far from the previous day. It will continue tabulating before resting on final numbers. The numbers on the right show how many people were sitting on each of those stories when the screenshot was taken. You may notice that there are duplicates within Chartbeat’s “top ten.” We attach query strings to stories based on where they are linked from. This allows us to track how much traffic a feature package is driving, as opposed to a blog post or a smaller link down the page. Surprisingly, people find the juiciest news no matter where on the page it may be, so seeing the real time stats combined with these ref strings gives our editors a good sense of which links are driving traffic to individual stories. Before Chartbeat, we wouldn’t have had that information until hours later, when we may have had 3 or 4 more features up and the news environment would be totally different.
The Now10 widget automatically refreshes every 15 seconds when present and filters out homepages, index pages and other uninteresting pages.
TPM Most Viewed
TPM’s second big use of chartbeat is our new public-facing Most Viewed widget. It’s currently only showing on a small number of pages, but we’ll be rolling it out to more over the coming weeks.

Since Chartbeat only gives you snapshots of how many people are on a given page at a certain time, in order to create the top ten list I needed to aggregate this data over a certain time period to flatten it out and give a true sense of what was most popular on the site. To do this, I wrote a PHP script that runs on a 5 minute cron. The script pulls toppages snapshots and saves it in a SQLite database. Every time the script is run, it queries the database and if it finds a matching title, it will combine the pageview counts. Otherwise it will add the new record to the table. The database also records its creation time. On a certain timeout (in our case, one hour), it will drop the table and write its aggregated results to a flat HTML file which is then embedded onto the page. On its next run, it will create a new table and start collecting again.
While this is still an imperfect measure of “most popular,” it does even out some of the spikes while still maintaining somewhat real time data.
The other reason we went with Chartbeat rather than GA to create this widget is because it allows authentication by API key rather than requiring a password or authsub passthrough. That makes it easier for a robot (my script) to access and process the data. Doing this through GA would have required me to “prop the door open” on something meant only for human access, which I wasn’t prepared to do.
Overall, Chartbeat has been an invaluable resource for TPM and I look forward to developing more with their APIs.
–Al Shaw, Associate Publisher, Talking Points Memo
Personal site: http://www.shhhaw.com
Twitter: @a_l